Level 400, episode 6. July’s evals article laid the method: golden dataset, three grading levels, threshold in CI. An excellent foundation — and a trap lurking inside it. You run the suite, you read “94%”, you deploy. But 94%… plus or minus how much?
Because a system non-deterministic by construction, measured on a small sample, produces a number that moves. Today, the statistical rigor that turns “we have 94%” into “we know what 94% is worth”. You’ll see: it’s not rocket science.
Variance: the same system, two different scores
First uncomfortable truth. Rerun your eval suite identically, changing nothing: the score moves. 94%, then 91%, then 95%. Nothing changed on your side — it’s the non-deterministic sampling talking, all the way into your measurements. Direct and brutal consequence: a single eval score is an observation, not a truth.
Hence the first engineer’s reflex: measure several times and look at the spread. Here we meet the notion of pass@k — the probability of succeeding at least once over k attempts. A case that passes 96% on average and a case that passes one time in two but that you happened to see green: the single score confuses them, the repeated measure separates them. On an agent where the user doesn’t retry, it’s the average — not the lucky draw — that counts.
The confidence interval: 50 cases is few
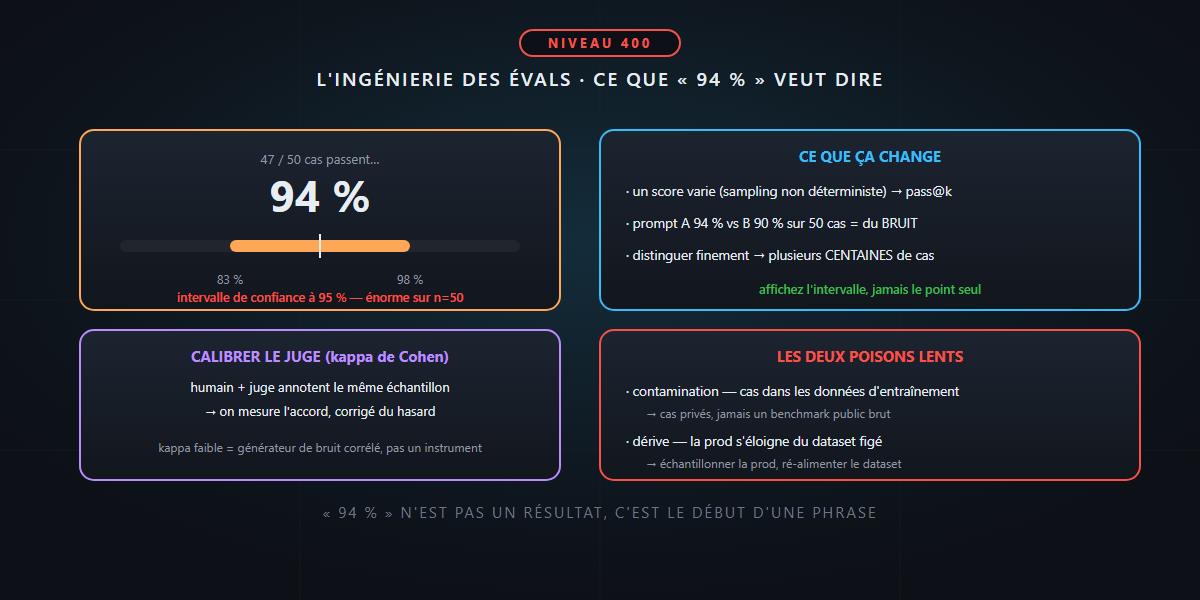
Here’s the calculation nobody does and that changes everything. You have 50 cases in your golden dataset, 47 pass: 94%. What’s the “true” quality of your system?
Statistics answer: with 47/50, the 95% confidence interval stretches from about 83% to 98%. In other words, your “94%” is compatible with a true quality of 84% as much as 98%. The error bar is enormous — because 50 samples is few. Two architect consequences:
- Comparing two prompts on a small dataset is often noise. Prompt A at 94%, prompt B at 90% over 50 cases? Their intervals overlap widely — you’ve proven nothing. Deploying B “because it’s better” is a decision made on thin air.
- Dataset size gets dimensioned. To distinguish 90% from 94% with confidence, you don’t need 50 cases but several hundred. Wanting to measure finely on a small sample is a design error, not a detail.
The rule: always show the interval, never the point alone. “94% [83–98%, n=50]” is honest information; “94%” is an illusion of precision.
Calibrating the judge: measure, don’t believe
The evals article recommended calibrating the LLM judge “until it agrees with the human”. Level 400: you quantify that agreement, you don’t decree it. The tool is Cohen’s kappa — a measure of agreement between two annotators corrected for chance (two judges who say “yes” 90% of the time often agree by pure luck; kappa removes that luck).
The protocol: a human annotates a sample (say 50 cases), the judge too, you compute kappa. Below solid agreement, your judge isn’t a reliable measuring instrument — it’s a correlated noise generator, and every score it produces inherits its bias. You refine the grading rubric, recompute, repeat. A thermometer gets calibrated before use; so does an LLM judge.
Contamination and drift: the two slow poisons
Two threats to validity over time:
- Contamination. If your test cases resemble public training data (or worse, leaked into it), the model “succeeds” by memorization, not by capability. The score is falsely good and predicts nothing about your real data. Reflex: cases from your private domain, renewed, never a public benchmark taken as is.
- Drift. The world moves: real production traffic slowly diverges from your frozen golden dataset. Your suite stays green while perceived quality drops — you’re faithfully measuring a bygone past. Reflex: sample production continuously (via OTel traces) to detect the distribution shift, and feed the dataset back — last night’s incident becoming tomorrow’s test case.
In summary
- An eval score varies (non-deterministic sampling): measure several times, think in pass@k, never in a single observation.
- On 50 cases, the confidence interval of “94%” runs roughly from 83 to 98%: comparing two prompts on a small dataset is often noise. Show the interval, dimension n.
- The LLM judge is calibrated with Cohen’s kappa — quantified human agreement; otherwise it’s a correlated noise generator.
- Watch for contamination (private cases, never a public benchmark) and drift (sample production, feed the dataset back).
“94%” isn’t a result, it’s the start of a sentence: 94%, on 50 cases, at ± 7 points, with a judge calibrated to kappa 0.8, on uncontaminated data. The difference between an intuition and a measurement. And that, honestly… is not rocket science.