“Why did the agent reimburse that expense claim at 3 a.m.?” With classic code, you’d read the logs and the stack trace. With an agent, the “why” lives elsewhere: in the conversation — which tools it called, with which arguments, what it read, what the model answered. A non-deterministic system can’t be debugged with printf.
The industry’s answer is called OpenTelemetry — and the Agent Framework article promised it in one line: “you replay the tape instead of guessing”. Today, we set up the screening room. You’ll see: it’s not rocket science.
OpenTelemetry in 60 seconds
OTel is the open standard for observability — three signals: logs (events), metrics (counters), and above all traces: the complete story of a request, cut into nested spans. A span = one operation with a start, an end, and attributes. Stacked together, they form the timeline of what actually happened — who called what, how long, with what result.
If you do modern ASP.NET, you’re already doing this without knowing: every HTTP request traces its span. What’s new is that the AI world has standardized its own spans.
The GenAI conventions: the shared vocabulary
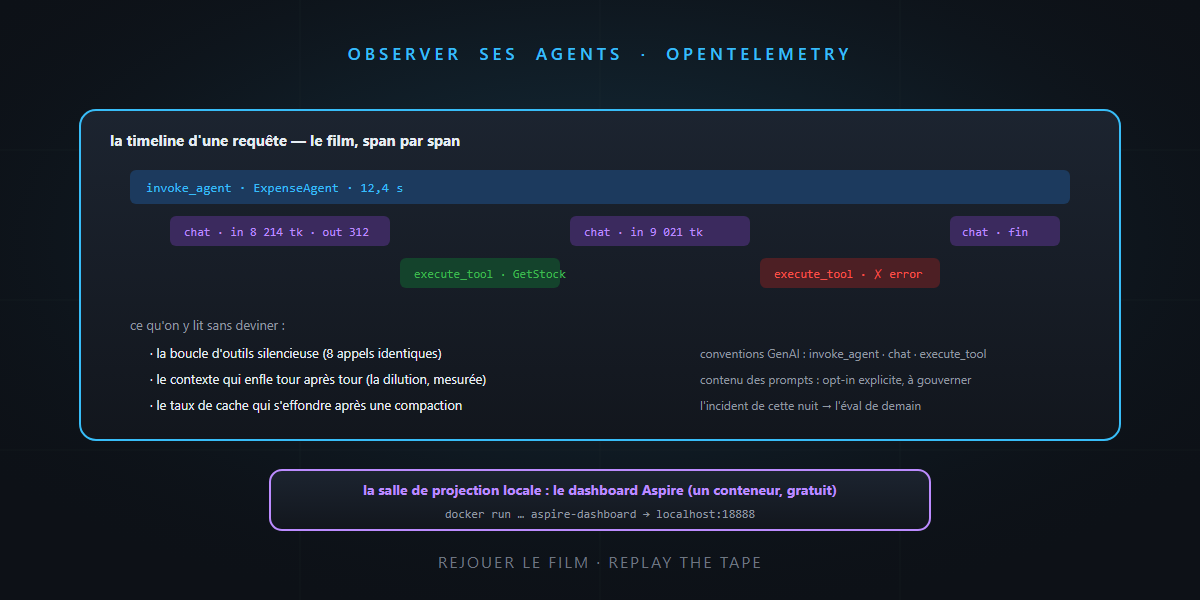
OpenTelemetry defines GenAI semantic conventions: standard span names and attributes for AI operations. The three spans that tell the whole story:
| Span | What it tells | Its key attributes |
|---|---|---|
invoke_agent |
one full agent turn | agent name, model |
chat |
one model call | model, input/output tokens, finish reason |
execute_tool |
one tool call | tool name, arguments |
The practical consequence is huge: since everyone speaks this language — Agent Framework, the SDKs, the backends — your observability tool understands your agents without custom configuration. And you recognize the attributes: the tokens from the bill, the tool calls from the loop — the series’ theory becomes columns in a dashboard.
Enabling it in Agent Framework: three lines (or zero)
Agent Framework instruments everything — agents, tools, workflows — as soon as you ask:
// At startup: wire OTel and export via OTLP (to Aspire, App Insights…)
builder.Services.AddOpenTelemetry()
    .WithTracing(t => t.AddSource("*Microsoft.Agents.AI").AddOtlpExporter())
    .WithMetrics(m => m.AddMeter("*Microsoft.Agents.AI").AddOtlpExporter());
And the “zero-code” version exists: environment variables are enough to enable instrumentation and export — precious for instrumenting without redeploying. One conscious choice remains: by default, traces contain the mechanics (which calls, which tokens, which durations) but not the content of prompts and responses — enabling that is an explicit opt-in. Keep the reflex straight from the memory article: sensitive data travels in those conversations; in production, trace the mechanics, sample the content, and govern who accesses it.
The local screening room: the Aspire dashboard
For development, no cloud backend needed: the Aspire dashboard is a standalone, free screening room that runs in one container:
docker run --rm -p 18888:18888 -p 4317:18889 \
  mcr.microsoft.com/dotnet/aspire-dashboard
Point your OTLP export at it (http://localhost:4317), run your agent, open localhost:18888 — and the movie appears: each request’s timeline, the invoke_agent span wrapping three chats and five execute_tools, tokens per call, durations, errors in red. The question “why did it do that?” becomes: click the span and read. (And if your project already runs on Aspire — wink at the base prompt — the dashboard is already there, for free.)
In production, same mechanics, different screen: Application Insights, or any OTLP backend — the GenAI conventions mean the “AI” views light up on their own.
What you’ll see (and stop guessing)
The classic discoveries of the first hours of agent observability — lived:
- The silent tool loop: the agent calls the same tool eight times with argument variations — invisible in the final answer, glaring in the timeline. (Often a mute error message that doesn’t help it self-correct.)
- The swelling context: input tokens climbing turn after turn — dilution made measurable, and the cache rate (yesterday’s
cached_tokens) collapsing after a compaction. - The slow subagent: 80% of the latency in a single nested
invoke_agent— an immediate candidate for a smaller model.
And the final virtuous loop, promised by the evals article: production traces feed the golden dataset. The case that derailed last night, exported from the dashboard, becomes the eval that prevents the regression. Observe → understand → test → redeploy: the full cycle of a grown-up AI application.
In summary
- An agent isn’t debugged with logs: it’s replayed — OTel traces and spans tell who called what, with which tokens and what result.
- The GenAI conventions standardize the vocabulary (
invoke_agent,chat,execute_tool): your tools understand your agents without custom work. - Agent Framework instruments itself in three lines (or via environment variables); conversation content stays an opt-in to govern.
- The Aspire dashboard is the free local screening room; App Insights or any OTLP backend takes over in production.
- And traces close the quality loop: last night’s incident becomes tomorrow’s eval.
The full movie of every agent decision, one click away: that’s what separates “we hope it works” from “we know what’s happening”. And that, honestly… is not rocket science.